Benchmarking

Once you have sized the cluster based on the expected numbers, it is time to validate whether it can meet the performance requirements.

Running benchmarks are helpful, but it is key to monitoring your cluster to understand the effect. We will use Grafana to monitor the cluster. The following metrics are important:

  • CPU - CPU cycles are required for query handling (parsing, planning, executing queries) and indexing data. CPU utilization of around 90% is a good first indicator that the cluster is well utilized. But looking at CPU usage alone can be misleading, as there is a fine line between well-utilizing and overloading the cluster

  • Memory usage. RAM

  • Thread pool—In CrateDB, each node has several thread pools for different operations, such as reading and writing data. Each thread pool has a fixed number of threads that process operations. If no free thread is available, requests are rejected, and operations are queued.

  • Number of active write threads

Ingest Benchmark

We will use the nodeIngestBench to benchmark the ingest. It is a multi-process Node.js script that runs high-performance ingest benchmarks on CrateDB. It uses a data model adapted from Timescale's Time Series Benchmark Suite (TSBS). One of the reasons to use nodeIngestBench is the fact that it is easy to configure and change variables like:

  • batchsize: The number of rows passed in a single INSERT statement. The higher the number, the fewer inserts you must perform to ingest the generated data. At the same time, there comes the point of diminishing returns.

  • max_rows: The maximum number of rows that will be generated. This is the parameter that allows the control of the total runtime of the benchmark.

  • shards: The number of shards the table will be split into. Each shard can be written independently, so we aim for a number that allows enough concurrency.

  • concurrent_requests: The number of INSERT statements that each child process will run concurrently as asynchronous operations.

  • processes: The main node process will start this number of parallel child processes (workers) that generate INSERT statements.

  • replicas: Replicas are pretty much pointless on single-node clusters. On multi-node clusters, however, they provide a great way to avoid data loss in case of node failure. For the 3-node cluster, we created one replica.

There are a couple of angles here.

  • The first is to see if the cluster can handle the projected workload.

  • Find the sweet spot where the cluster can handle the workload with the lowest impact on resources. This is about finding the optimal balance between the number of shards, the batch size, the number of processes, and other factors.

  • Then, there is finding the limits of the current cluster. When does the curve flatten?

Environment

We use a three-node CR2 CrateDB Cloud Cluster in Azure EU-WEST for the benchmark exercise. a CR2 cluster has the following configuration for each node:

  • 4 vCPU

  • 14 GiB RAM

  • 32 GiB SSD Storage

These are per-node resources. When deploying multi-node clusters, multiply these by the number of nodes. Storage is a big part of fast writing. Offered storage depends on the tier of the cluster, but in general, we offer storage of up to 8 TiB of enterprise-level SSD per node.

For the ingesting tool/benchmark VM, we decided on the Standard_D48_v3**. **We don't need all 48 CPUs this instance offers, but it's the most affordable instance with 24 Gigabit networking, which can be necessary when ingesting into higher-tier CrateDB Cloud clusters.

Deploy nodeIngestBench

  • Install Node.js using one of the available installation methods

  • Clone this repository: git clone https://github.com/proddata/nodeIngestBench.git

  • Change into the cloned repository: cd nodeIngestBench

  • Install dependencies: npm install

  • Configure the connection to your CrateDB cluster by creating a .env file:

CRATE_HOST=hostname
CRATE_USER=admin
CRATE_PASSWORD=<PASSWORD>
CRATE_PORT=4200
CRATE_SSL=true

Run a quick test to see if you can connect.

node appCluster.js --batch_size 1000 --max_rows 20000 --shards 12 --concurrent_requests 1 --processes 1

If this is successful, then you are set to start benchmarking.

nodeIngestBench will create a table doc.cpu that has the following structure:

CREATE TABLE IF NOT EXISTS doc.cpu ( 
 "tags" OBJECT(DYNAMIC) AS ( 
   "arch" TEXT, 
   "datacenter" TEXT, 
   "hostname" TEXT, 
   "os" TEXT, 
   "rack" TEXT, 
   "region" TEXT, 
   "service" TEXT, 
   "service_environment" TEXT, 
   "service_version" TEXT, 
   "team" TEXT 
 ), 
 "ts" TIMESTAMP WITH TIME ZONE, 
 "usage_user" INTEGER, 
 "usage_system" INTEGER, 
 "usage_idle" INTEGER, 
 "usage_nice" INTEGER, 
 "usage_iowait" INTEGER, 
 "usage_irq" INTEGER, 
 "usage_softirq" INTEGER, 
 "usage_steal" INTEGER, 
 "usage_guest" INTEGER, 
 "usage_guest_nice" INTEGER 
) 
CLUSTERED INTO <number of shards> SHARDS 
WITH (number_of_replicas = <number of replicas>);

Install & Configure Grafana

A Grafana OSS (docker) container is deployed on the ingest VM for this test. However, if Grafana is already running in your environment, you can skip this installation step.

For this blog, we used the following Grafana Dashboard that can be imported into Grafana.

dash.json
{
  "annotations": {
    "list": [
      {
        "builtIn": 1,
        "datasource": {
          "type": "datasource",
          "uid": "grafana"
        },
        "enable": true,
        "hide": true,
        "iconColor": "rgba(0, 211, 255, 1)",
        "name": "Annotations & Alerts",
        "target": {
          "limit": 100,
          "matchAny": false,
          "tags": [],
          "type": "dashboard"
        },
        "type": "dashboard"
      }
    ]
  },
  "editable": true,
  "fiscalYearStartMonth": 0,
  "graphTooltip": 0,
  "id": 9,
  "links": [],
  "panels": [
    {
      "datasource": {
        "type": "prometheus",
        "uid": "bed18wmashvy8e"
      },
      "fieldConfig": {
        "defaults": {
          "color": {
            "mode": "palette-classic"
          },
          "custom": {
            "axisBorderShow": false,
            "axisCenteredZero": false,
            "axisColorMode": "text",
            "axisLabel": "",
            "axisPlacement": "auto",
            "barAlignment": 0,
            "barWidthFactor": 0.6,
            "drawStyle": "line",
            "fillOpacity": 0,
            "gradientMode": "none",
            "hideFrom": {
              "legend": false,
              "tooltip": false,
              "viz": false
            },
            "insertNulls": false,
            "lineInterpolation": "linear",
            "lineWidth": 1,
            "pointSize": 5,
            "scaleDistribution": {
              "type": "linear"
            },
            "showPoints": "auto",
            "spanNulls": false,
            "stacking": {
              "group": "A",
              "mode": "none"
            },
            "thresholdsStyle": {
              "mode": "off"
            }
          },
          "mappings": [],
          "thresholds": {
            "mode": "absolute",
            "steps": [
              {
                "color": "green",
                "value": null
              },
              {
                "color": "red",
                "value": 80
              }
            ]
          }
        },
        "overrides": []
      },
      "gridPos": {
        "h": 8,
        "w": 12,
        "x": 0,
        "y": 0
      },
      "id": 39,
      "options": {
        "legend": {
          "calcs": [],
          "displayMode": "list",
          "placement": "bottom",
          "showLegend": true
        },
        "tooltip": {
          "hideZeros": false,
          "mode": "single",
          "sort": "none"
        }
      },
      "pluginVersion": "11.5.1",
      "targets": [
        {
          "datasource": {
            "type": "prometheus",
            "uid": "bed18wmashvy8e"
          },
          "editorMode": "code",
          "expr": "sum(rate(crate_threadpools{name=\"generic\", property=\"active\", namespace=\"$namespace\"}[5m]))",
          "instant": false,
          "legendFormat": "__auto",
          "range": true,
          "refId": "A"
        }
      ],
      "title": "Threadpool Active ",
      "type": "timeseries"
    },
    {
      "collapsed": false,
      "gridPos": {
        "h": 1,
        "w": 24,
        "x": 0,
        "y": 8
      },
      "id": 4,
      "panels": [],
      "title": "Global Stats",
      "type": "row"
    },
    {
      "datasource": {
        "uid": "${datasource}"
      },
      "fieldConfig": {
        "defaults": {
          "color": {
            "mode": "thresholds"
          },
          "mappings": [],
          "thresholds": {
            "mode": "absolute",
            "steps": [
              {
                "color": "green",
                "value": null
              },
              {
                "color": "red",
                "value": 80
              }
            ]
          }
        },
        "overrides": []
      },
      "gridPos": {
        "h": 11,
        "w": 5,
        "x": 0,
        "y": 9
      },
      "id": 7,
      "options": {
        "colorMode": "value",
        "graphMode": "area",
        "justifyMode": "auto",
        "orientation": "auto",
        "percentChangeColorMode": "standard",
        "reduceOptions": {
          "calcs": [
            "lastNotNull"
          ],
          "fields": "",
          "values": false
        },
        "showPercentChange": false,
        "text": {},
        "textMode": "auto",
        "wideLayout": true
      },
      "pluginVersion": "11.5.1",
      "targets": [
        {
          "datasource": {
            "uid": "${datasource}"
          },
          "editorMode": "code",
          "exemplar": true,
          "expr": "count(container_cpu_usage_seconds_total{container=\"crate\",namespace=\"$namespace\"})",
          "instant": true,
          "interval": "",
          "legendFormat": "",
          "queryType": "randomWalk",
          "refId": "A"
        }
      ],
      "title": "Number of CrateDB Nodes (Pods)",
      "type": "stat"
    },
    {
      "datasource": {
        "type": "datasource",
        "uid": "-- Mixed --"
      },
      "description": "Queries per second for overall queries.",
      "fieldConfig": {
        "defaults": {
          "color": {
            "mode": "palette-classic"
          },
          "custom": {
            "axisBorderShow": false,
            "axisCenteredZero": false,
            "axisColorMode": "text",
            "axisLabel": "queries/s",
            "axisPlacement": "auto",
            "barAlignment": 0,
            "barWidthFactor": 0.6,
            "drawStyle": "line",
            "fillOpacity": 10,
            "gradientMode": "none",
            "hideFrom": {
              "legend": false,
              "tooltip": false,
              "viz": false
            },
            "insertNulls": false,
            "lineInterpolation": "linear",
            "lineWidth": 1,
            "pointSize": 5,
            "scaleDistribution": {
              "type": "linear"
            },
            "showPoints": "never",
            "spanNulls": false,
            "stacking": {
              "group": "A",
              "mode": "none"
            },
            "thresholdsStyle": {
              "mode": "off"
            }
          },
          "links": [],
          "mappings": [],
          "min": 0,
          "thresholds": {
            "mode": "absolute",
            "steps": [
              {
                "color": "green",
                "value": null
              },
              {
                "color": "red",
                "value": 80
              }
            ]
          },
          "unit": "ops"
        },
        "overrides": []
      },
      "gridPos": {
        "h": 11,
        "w": 19,
        "x": 5,
        "y": 9
      },
      "id": 25,
      "options": {
        "alertThreshold": true,
        "legend": {
          "calcs": [],
          "displayMode": "list",
          "placement": "right",
          "showLegend": true
        },
        "tooltip": {
          "hideZeros": false,
          "mode": "multi",
          "sort": "none"
        }
      },
      "pluginVersion": "11.5.1",
      "targets": [
        {
          "datasource": {
            "uid": "$datasource"
          },
          "editorMode": "code",
          "exemplar": false,
          "expr": "sum(rate(crate_query_total_count{namespace=\"$namespace\"}[5m])) by (query)",
          "format": "time_series",
          "instant": false,
          "interval": "",
          "legendFormat": "__auto",
          "range": true,
          "refId": "E"
        }
      ],
      "title": "Queries Per Second",
      "type": "timeseries"
    },
    {
      "datasource": {
        "type": "prometheus",
        "uid": "bed18wmashvy8e"
      },
      "fieldConfig": {
        "defaults": {
          "color": {
            "mode": "palette-classic"
          },
          "custom": {
            "axisBorderShow": false,
            "axisCenteredZero": false,
            "axisColorMode": "text",
            "axisLabel": "",
            "axisPlacement": "auto",
            "barAlignment": 0,
            "barWidthFactor": 0.6,
            "drawStyle": "line",
            "fillOpacity": 0,
            "gradientMode": "none",
            "hideFrom": {
              "legend": false,
              "tooltip": false,
              "viz": false
            },
            "insertNulls": false,
            "lineInterpolation": "linear",
            "lineWidth": 1,
            "pointSize": 5,
            "scaleDistribution": {
              "type": "linear"
            },
            "showPoints": "auto",
            "spanNulls": false,
            "stacking": {
              "group": "A",
              "mode": "none"
            },
            "thresholdsStyle": {
              "mode": "off"
            }
          },
          "mappings": [],
          "thresholds": {
            "mode": "absolute",
            "steps": [
              {
                "color": "green",
                "value": null
              },
              {
                "color": "red",
                "value": 80
              }
            ]
          }
        },
        "overrides": []
      },
      "gridPos": {
        "h": 11,
        "w": 24,
        "x": 0,
        "y": 20
      },
      "id": 37,
      "options": {
        "legend": {
          "calcs": [],
          "displayMode": "list",
          "placement": "bottom",
          "showLegend": true
        },
        "tooltip": {
          "hideZeros": false,
          "mode": "single",
          "sort": "none"
        }
      },
      "pluginVersion": "11.5.1",
      "targets": [
        {
          "datasource": {
            "type": "prometheus",
            "uid": "bed18wmashvy8e"
          },
          "editorMode": "code",
          "expr": "(sum (rate(container_cpu_usage_seconds_total{namespace=\"$namespace\", pod=~\"crate-.*\"}[5m])) * 100)/count (container_cpu_usage_seconds_total{namespace=\"$namespace\", pod=~\"crate-.*\"})",
          "hide": true,
          "instant": false,
          "legendFormat": "__auto",
          "range": true,
          "refId": "A"
        },
        {
          "datasource": {
            "type": "prometheus",
            "uid": "bed18wmashvy8e"
          },
          "editorMode": "code",
          "expr": "(sum by (pod) (rate(container_cpu_usage_seconds_total{namespace=\"$namespace\", pod=~\"crate-.*\"}[5m])) * 100)/count by (pod) (container_cpu_usage_seconds_total{namespace=\"$namespace\", pod=~\"crate-.*\"})",
          "hide": true,
          "instant": false,
          "legendFormat": "__auto",
          "range": true,
          "refId": "B"
        },
        {
          "datasource": {
            "type": "prometheus",
            "uid": "bed18wmashvy8e"
          },
          "editorMode": "code",
          "expr": "(sum by (pod) (rate(container_cpu_usage_seconds_total{namespace=\"$namespace\", pod=~\"crate-.*\"}[5m])/8) * 100)",
          "hide": false,
          "instant": false,
          "legendFormat": "__auto",
          "range": true,
          "refId": "C"
        }
      ],
      "title": "CPU per POD",
      "type": "timeseries"
    },
    {
      "datasource": {
        "uid": "${datasource}"
      },
      "fieldConfig": {
        "defaults": {
          "color": {
            "mode": "palette-classic"
          },
          "custom": {
            "axisBorderShow": false,
            "axisCenteredZero": false,
            "axisColorMode": "text",
            "axisLabel": "",
            "axisPlacement": "auto",
            "barAlignment": 0,
            "barWidthFactor": 0.6,
            "drawStyle": "line",
            "fillOpacity": 0,
            "gradientMode": "none",
            "hideFrom": {
              "legend": false,
              "tooltip": false,
              "viz": false
            },
            "insertNulls": false,
            "lineInterpolation": "linear",
            "lineWidth": 1,
            "pointSize": 5,
            "scaleDistribution": {
              "type": "linear"
            },
            "showPoints": "auto",
            "spanNulls": false,
            "stacking": {
              "group": "A",
              "mode": "none"
            },
            "thresholdsStyle": {
              "mode": "off"
            }
          },
          "mappings": [],
          "thresholds": {
            "mode": "absolute",
            "steps": [
              {
                "color": "green",
                "value": null
              },
              {
                "color": "red",
                "value": 80
              }
            ]
          },
          "unit": "decbytes"
        },
        "overrides": []
      },
      "gridPos": {
        "h": 8,
        "w": 24,
        "x": 0,
        "y": 31
      },
      "id": 12,
      "options": {
        "legend": {
          "calcs": [],
          "displayMode": "list",
          "placement": "bottom",
          "showLegend": true
        },
        "tooltip": {
          "hideZeros": false,
          "mode": "single",
          "sort": "none"
        }
      },
      "pluginVersion": "11.5.1",
      "targets": [
        {
          "datasource": {
            "uid": "${datasource}"
          },
          "editorMode": "code",
          "exemplar": true,
          "expr": "rate(container_memory_usage_bytes{container=\"crate\", pod=~\".*$cluster.*\",namespace='$namespace'}[5m])",
          "interval": "",
          "legendFormat": "",
          "queryType": "randomWalk",
          "range": true,
          "refId": "A"
        },
        {
          "datasource": {
            "type": "prometheus",
            "uid": "${datasource}"
          },
          "editorMode": "code",
          "expr": "sum(rate(container_memory_usage_bytes{container=\"crate\", pod=~\".*$cluster.*\", namespace=\"$namespace\"}[5m]))",
          "hide": false,
          "instant": false,
          "legendFormat": "__auto",
          "range": true,
          "refId": "SUM"
        }
      ],
      "title": "Memory Usage",
      "type": "timeseries"
    },
    {
      "datasource": {
        "type": "prometheus",
        "uid": "bed18wmashvy8e"
      },
      "fieldConfig": {
        "defaults": {
          "color": {
            "mode": "palette-classic"
          },
          "custom": {
            "axisBorderShow": false,
            "axisCenteredZero": false,
            "axisColorMode": "text",
            "axisLabel": "",
            "axisPlacement": "auto",
            "barAlignment": 0,
            "barWidthFactor": 0.6,
            "drawStyle": "line",
            "fillOpacity": 0,
            "gradientMode": "none",
            "hideFrom": {
              "legend": false,
              "tooltip": false,
              "viz": false
            },
            "insertNulls": false,
            "lineInterpolation": "linear",
            "lineWidth": 1,
            "pointSize": 5,
            "scaleDistribution": {
              "type": "linear"
            },
            "showPoints": "auto",
            "spanNulls": false,
            "stacking": {
              "group": "A",
              "mode": "none"
            },
            "thresholdsStyle": {
              "mode": "off"
            }
          },
          "mappings": [],
          "thresholds": {
            "mode": "absolute",
            "steps": [
              {
                "color": "green",
                "value": null
              },
              {
                "color": "red",
                "value": 80
              }
            ]
          }
        },
        "overrides": []
      },
      "gridPos": {
        "h": 9,
        "w": 24,
        "x": 0,
        "y": 39
      },
      "id": 34,
      "options": {
        "legend": {
          "calcs": [],
          "displayMode": "list",
          "placement": "bottom",
          "showLegend": true
        },
        "tooltip": {
          "hideZeros": false,
          "mode": "single",
          "sort": "none"
        }
      },
      "pluginVersion": "11.5.1",
      "targets": [
        {
          "datasource": {
            "type": "prometheus",
            "uid": "bed18wmashvy8e"
          },
          "editorMode": "code",
          "expr": "sum(rate(crate_threadpools{name=\"write\", property=\"rejected\", namespace=\"$namespace\"}[5m]))",
          "instant": false,
          "legendFormat": "__auto",
          "range": true,
          "refId": "A"
        },
        {
          "datasource": {
            "type": "prometheus",
            "uid": "bed18wmashvy8e"
          },
          "editorMode": "code",
          "expr": "rate(crate_threadpools{name=\"write\", property=\"rejected\", namespace=\"$namespace\"}[5m])",
          "hide": false,
          "instant": false,
          "legendFormat": "__auto",
          "range": true,
          "refId": "B"
        },
        {
          "datasource": {
            "type": "prometheus",
            "uid": "bed18wmashvy8e"
          },
          "editorMode": "code",
          "expr": "sum by (name, property) (rate(crate_threadpools{namespace=\"$namespace\"}[5m]))",
          "hide": false,
          "instant": false,
          "legendFormat": "__auto",
          "range": true,
          "refId": "C"
        }
      ],
      "title": "Threadpools",
      "type": "timeseries"
    },
    {
      "datasource": {
        "type": "prometheus",
        "uid": "bed18wmashvy8e"
      },
      "fieldConfig": {
        "defaults": {
          "color": {
            "mode": "palette-classic"
          },
          "custom": {
            "axisBorderShow": false,
            "axisCenteredZero": false,
            "axisColorMode": "text",
            "axisLabel": "",
            "axisPlacement": "auto",
            "barAlignment": 0,
            "barWidthFactor": 0.6,
            "drawStyle": "line",
            "fillOpacity": 0,
            "gradientMode": "none",
            "hideFrom": {
              "legend": false,
              "tooltip": false,
              "viz": false
            },
            "insertNulls": false,
            "lineInterpolation": "linear",
            "lineWidth": 1,
            "pointSize": 5,
            "scaleDistribution": {
              "type": "linear"
            },
            "showPoints": "auto",
            "spanNulls": false,
            "stacking": {
              "group": "A",
              "mode": "none"
            },
            "thresholdsStyle": {
              "mode": "off"
            }
          },
          "mappings": [],
          "thresholds": {
            "mode": "absolute",
            "steps": [
              {
                "color": "green",
                "value": null
              },
              {
                "color": "red",
                "value": 80
              }
            ]
          }
        },
        "overrides": []
      },
      "gridPos": {
        "h": 8,
        "w": 12,
        "x": 0,
        "y": 48
      },
      "id": 35,
      "options": {
        "legend": {
          "calcs": [],
          "displayMode": "list",
          "placement": "bottom",
          "showLegend": true
        },
        "tooltip": {
          "hideZeros": false,
          "mode": "single",
          "sort": "none"
        }
      },
      "pluginVersion": "11.5.1",
      "targets": [
        {
          "datasource": {
            "type": "prometheus",
            "uid": "bed18wmashvy8e"
          },
          "editorMode": "code",
          "expr": "sum(crate_node{name=\"shard_stats\", namespace=\"$namespace\"}) by (property)",
          "instant": false,
          "legendFormat": "__auto",
          "range": true,
          "refId": "A"
        }
      ],
      "title": "Shards",
      "type": "timeseries"
    },
    {
      "datasource": {
        "type": "prometheus",
        "uid": "bed18wmashvy8e"
      },
      "description": "schema!=\"gc\"",
      "fieldConfig": {
        "defaults": {
          "color": {
            "mode": "palette-classic"
          },
          "custom": {
            "axisBorderShow": false,
            "axisCenteredZero": false,
            "axisColorMode": "text",
            "axisLabel": "",
            "axisPlacement": "auto",
            "barAlignment": 0,
            "barWidthFactor": 0.6,
            "drawStyle": "line",
            "fillOpacity": 0,
            "gradientMode": "none",
            "hideFrom": {
              "legend": false,
              "tooltip": false,
              "viz": false
            },
            "insertNulls": false,
            "lineInterpolation": "linear",
            "lineWidth": 1,
            "pointSize": 5,
            "scaleDistribution": {
              "type": "linear"
            },
            "showPoints": "auto",
            "spanNulls": false,
            "stacking": {
              "group": "A",
              "mode": "none"
            },
            "thresholdsStyle": {
              "mode": "off"
            }
          },
          "mappings": [],
          "thresholds": {
            "mode": "absolute",
            "steps": [
              {
                "color": "green",
                "value": null
              },
              {
                "color": "red",
                "value": 80
              }
            ]
          }
        },
        "overrides": []
      },
      "gridPos": {
        "h": 8,
        "w": 12,
        "x": 12,
        "y": 48
      },
      "id": 38,
      "options": {
        "legend": {
          "calcs": [],
          "displayMode": "list",
          "placement": "bottom",
          "showLegend": true
        },
        "tooltip": {
          "hideZeros": false,
          "mode": "single",
          "sort": "none"
        }
      },
      "pluginVersion": "11.5.1",
      "targets": [
        {
          "datasource": {
            "type": "prometheus",
            "uid": "bed18wmashvy8e"
          },
          "editorMode": "code",
          "expr": "sum by (pod_name, table) (crate_node{name=\"shard_info\", namespace=\"$namespace\", property=\"size\", schema!=\"gc\"})/1024/1024/1024",
          "instant": false,
          "legendFormat": "__auto",
          "range": true,
          "refId": "A"
        },
        {
          "datasource": {
            "type": "prometheus",
            "uid": "bed18wmashvy8e"
          },
          "editorMode": "code",
          "expr": "sum by (table) (crate_node{name=\"shard_info\", namespace=\"$namespace\", property=\"size\", schema!=\"gc\"}) / 1024 / 1024 / 1024",
          "hide": false,
          "instant": false,
          "legendFormat": "__auto",
          "range": true,
          "refId": "B"
        }
      ],
      "title": "Shard Size (GiB)",
      "type": "timeseries"
    },
    {
      "datasource": {
        "uid": "${datasource}"
      },
      "fieldConfig": {
        "defaults": {
          "color": {
            "mode": "palette-classic"
          },
          "custom": {
            "axisBorderShow": false,
            "axisCenteredZero": false,
            "axisColorMode": "text",
            "axisLabel": "",
            "axisPlacement": "auto",
            "barAlignment": 0,
            "barWidthFactor": 0.6,
            "drawStyle": "line",
            "fillOpacity": 0,
            "gradientMode": "none",
            "hideFrom": {
              "legend": false,
              "tooltip": false,
              "viz": false
            },
            "insertNulls": false,
            "lineInterpolation": "linear",
            "lineWidth": 1,
            "pointSize": 5,
            "scaleDistribution": {
              "type": "linear"
            },
            "showPoints": "auto",
            "spanNulls": false,
            "stacking": {
              "group": "A",
              "mode": "none"
            },
            "thresholdsStyle": {
              "mode": "off"
            }
          },
          "mappings": [],
          "thresholds": {
            "mode": "absolute",
            "steps": [
              {
                "color": "green",
                "value": null
              },
              {
                "color": "red",
                "value": 80
              }
            ]
          },
          "unit": "Bps"
        },
        "overrides": []
      },
      "gridPos": {
        "h": 8,
        "w": 12,
        "x": 0,
        "y": 56
      },
      "id": 17,
      "options": {
        "legend": {
          "calcs": [],
          "displayMode": "list",
          "placement": "bottom",
          "showLegend": true
        },
        "tooltip": {
          "hideZeros": false,
          "mode": "single",
          "sort": "none"
        }
      },
      "pluginVersion": "11.5.1",
      "targets": [
        {
          "datasource": {
            "uid": "${datasource}"
          },
          "editorMode": "code",
          "exemplar": true,
          "expr": "rate(container_fs_reads_bytes_total{container=\"crate\", pod=~\".*$cluster.*\",namespace='$namespace'}[5m])",
          "hide": false,
          "interval": "",
          "legendFormat": " ",
          "range": true,
          "refId": "A"
        }
      ],
      "title": "File System Reads",
      "type": "timeseries"
    },
    {
      "datasource": {
        "uid": "${datasource}"
      },
      "fieldConfig": {
        "defaults": {
          "color": {
            "mode": "palette-classic"
          },
          "custom": {
            "axisBorderShow": false,
            "axisCenteredZero": false,
            "axisColorMode": "text",
            "axisLabel": "",
            "axisPlacement": "auto",
            "barAlignment": 0,
            "barWidthFactor": 0.6,
            "drawStyle": "line",
            "fillOpacity": 0,
            "gradientMode": "none",
            "hideFrom": {
              "legend": false,
              "tooltip": false,
              "viz": false
            },
            "insertNulls": false,
            "lineInterpolation": "linear",
            "lineWidth": 1,
            "pointSize": 5,
            "scaleDistribution": {
              "type": "linear"
            },
            "showPoints": "auto",
            "spanNulls": false,
            "stacking": {
              "group": "A",
              "mode": "none"
            },
            "thresholdsStyle": {
              "mode": "off"
            }
          },
          "mappings": [],
          "thresholds": {
            "mode": "absolute",
            "steps": [
              {
                "color": "green",
                "value": null
              },
              {
                "color": "red",
                "value": 80
              }
            ]
          },
          "unit": "Bps"
        },
        "overrides": []
      },
      "gridPos": {
        "h": 8,
        "w": 12,
        "x": 12,
        "y": 56
      },
      "id": 16,
      "options": {
        "legend": {
          "calcs": [],
          "displayMode": "list",
          "placement": "bottom",
          "showLegend": true
        },
        "tooltip": {
          "hideZeros": false,
          "mode": "single",
          "sort": "none"
        }
      },
      "pluginVersion": "11.5.1",
      "targets": [
        {
          "datasource": {
            "uid": "${datasource}"
          },
          "editorMode": "code",
          "exemplar": true,
          "expr": "rate(container_fs_writes_bytes_total{container=\"crate\", pod=~\".*$cluster.*\",namespace='$namespace'}[5m]) > 0",
          "interval": "",
          "legendFormat": " ",
          "queryType": "randomWalk",
          "range": true,
          "refId": "A"
        }
      ],
      "title": "File System Writes",
      "type": "timeseries"
    },
    {
      "datasource": {
        "type": "prometheus",
        "uid": "bed18wmashvy8e"
      },
      "fieldConfig": {
        "defaults": {
          "color": {
            "mode": "palette-classic"
          },
          "custom": {
            "axisBorderShow": false,
            "axisCenteredZero": false,
            "axisColorMode": "text",
            "axisLabel": "",
            "axisPlacement": "auto",
            "barAlignment": 0,
            "barWidthFactor": 0.6,
            "drawStyle": "line",
            "fillOpacity": 0,
            "gradientMode": "none",
            "hideFrom": {
              "legend": false,
              "tooltip": false,
              "viz": false
            },
            "insertNulls": false,
            "lineInterpolation": "linear",
            "lineWidth": 1,
            "pointSize": 5,
            "scaleDistribution": {
              "type": "linear"
            },
            "showPoints": "auto",
            "spanNulls": false,
            "stacking": {
              "group": "A",
              "mode": "none"
            },
            "thresholdsStyle": {
              "mode": "off"
            }
          },
          "mappings": [],
          "min": 0,
          "noValue": "0",
          "thresholds": {
            "mode": "absolute",
            "steps": [
              {
                "color": "green",
                "value": null
              },
              {
                "color": "red",
                "value": 80
              }
            ]
          }
        },
        "overrides": []
      },
      "gridPos": {
        "h": 8,
        "w": 12,
        "x": 0,
        "y": 64
      },
      "id": 30,
      "options": {
        "legend": {
          "calcs": [],
          "displayMode": "list",
          "placement": "bottom",
          "showLegend": true
        },
        "tooltip": {
          "hideZeros": false,
          "mode": "single",
          "sort": "none"
        }
      },
      "pluginVersion": "11.5.1",
      "targets": [
        {
          "datasource": {
            "type": "prometheus",
            "uid": "bed18wmashvy8e"
          },
          "editorMode": "code",
          "expr": "sum by (pod) (rate(container_network_receive_bytes_total{namespace=\"$namespace\", pod=~\"crate-.*\"}[5m]) / 1024)",
          "instant": false,
          "legendFormat": "__auto",
          "range": true,
          "refId": "A"
        },
        {
          "datasource": {
            "type": "prometheus",
            "uid": "bed18wmashvy8e"
          },
          "editorMode": "code",
          "expr": "sum(rate(container_network_receive_bytes_total{namespace=\"$namespace\", pod=~\"crate-.*\"}[5m]) / 1024)",
          "hide": false,
          "instant": false,
          "legendFormat": "__auto",
          "range": true,
          "refId": "B"
        }
      ],
      "title": "Network Receive (KB/s) Per Pod",
      "type": "timeseries"
    },
    {
      "datasource": {
        "type": "prometheus",
        "uid": "bed18wmashvy8e"
      },
      "fieldConfig": {
        "defaults": {
          "color": {
            "mode": "palette-classic"
          },
          "custom": {
            "axisBorderShow": false,
            "axisCenteredZero": false,
            "axisColorMode": "text",
            "axisLabel": "",
            "axisPlacement": "auto",
            "barAlignment": 0,
            "barWidthFactor": 0.6,
            "drawStyle": "line",
            "fillOpacity": 0,
            "gradientMode": "none",
            "hideFrom": {
              "legend": false,
              "tooltip": false,
              "viz": false
            },
            "insertNulls": false,
            "lineInterpolation": "linear",
            "lineWidth": 1,
            "pointSize": 5,
            "scaleDistribution": {
              "type": "linear"
            },
            "showPoints": "auto",
            "spanNulls": false,
            "stacking": {
              "group": "A",
              "mode": "none"
            },
            "thresholdsStyle": {
              "mode": "off"
            }
          },
          "mappings": [],
          "min": 0,
          "noValue": "0",
          "thresholds": {
            "mode": "absolute",
            "steps": [
              {
                "color": "green",
                "value": null
              },
              {
                "color": "red",
                "value": 80
              }
            ]
          }
        },
        "overrides": []
      },
      "gridPos": {
        "h": 8,
        "w": 12,
        "x": 12,
        "y": 64
      },
      "id": 31,
      "options": {
        "legend": {
          "calcs": [],
          "displayMode": "list",
          "placement": "bottom",
          "showLegend": true
        },
        "tooltip": {
          "hideZeros": false,
          "mode": "single",
          "sort": "none"
        }
      },
      "pluginVersion": "11.5.1",
      "targets": [
        {
          "datasource": {
            "type": "prometheus",
            "uid": "bed18wmashvy8e"
          },
          "editorMode": "code",
          "expr": "sum by (pod) (rate(container_network_transmit_bytes_total{namespace=\"$namespace\", pod=~\"crate-.*\"}[5m]) / 1024)",
          "instant": false,
          "legendFormat": "__auto",
          "range": true,
          "refId": "A"
        },
        {
          "datasource": {
            "type": "prometheus",
            "uid": "bed18wmashvy8e"
          },
          "editorMode": "code",
          "expr": "sum(rate(container_network_transmit_bytes_total{namespace=\"$namespace\", pod=~\"crate-.*\"}[5m]) / 1024)",
          "hide": false,
          "instant": false,
          "legendFormat": "__auto",
          "range": true,
          "refId": "B"
        }
      ],
      "title": "Network Transmit (KB/s) Per Pod",
      "type": "timeseries"
    },
    {
      "collapsed": false,
      "gridPos": {
        "h": 1,
        "w": 24,
        "x": 0,
        "y": 72
      },
      "id": 6,
      "panels": [],
      "title": "Cluster Stats",
      "type": "row"
    },
    {
      "collapsed": false,
      "gridPos": {
        "h": 1,
        "w": 24,
        "x": 0,
        "y": 73
      },
      "id": 19,
      "panels": [],
      "title": "Query Stats",
      "type": "row"
    },
    {
      "datasource": {
        "type": "datasource",
        "uid": "-- Mixed --"
      },
      "fieldConfig": {
        "defaults": {
          "color": {
            "mode": "palette-classic"
          },
          "custom": {
            "axisBorderShow": false,
            "axisCenteredZero": false,
            "axisColorMode": "text",
            "axisLabel": "",
            "axisPlacement": "auto",
            "barAlignment": 0,
            "barWidthFactor": 0.6,
            "drawStyle": "line",
            "fillOpacity": 10,
            "gradientMode": "none",
            "hideFrom": {
              "legend": false,
              "tooltip": false,
              "viz": false
            },
            "insertNulls": false,
            "lineInterpolation": "linear",
            "lineWidth": 1,
            "pointSize": 5,
            "scaleDistribution": {
              "type": "linear"
            },
            "showPoints": "never",
            "spanNulls": false,
            "stacking": {
              "group": "A",
              "mode": "none"
            },
            "thresholdsStyle": {
              "mode": "off"
            }
          },
          "links": [],
          "mappings": [],
          "min": 0,
          "thresholds": {
            "mode": "absolute",
            "steps": [
              {
                "color": "green"
              },
              {
                "color": "red",
                "value": 80
              }
            ]
          },
          "unit": "ops"
        },
        "overrides": []
      },
      "gridPos": {
        "h": 8,
        "w": 12,
        "x": 0,
        "y": 74
      },
      "id": 21,
      "options": {
        "alertThreshold": true,
        "legend": {
          "calcs": [],
          "displayMode": "list",
          "placement": "right",
          "showLegend": true
        },
        "tooltip": {
          "hideZeros": false,
          "mode": "multi",
          "sort": "none"
        }
      },
      "pluginVersion": "11.5.1",
      "targets": [
        {
          "datasource": {
            "uid": "$datasource"
          },
          "expr": "sum(rate(crate_query_failed_count{namespace=\"$namespace\"}[5m])) by (query)",
          "interval": "",
          "legendFormat": "",
          "refId": "E"
        }
      ],
      "title": "Query error rate",
      "type": "timeseries"
    },
    {
      "datasource": {
        "type": "datasource",
        "uid": "-- Mixed --"
      },
      "description": "The average query duration for a overall queries.",
      "fieldConfig": {
        "defaults": {
          "color": {
            "mode": "palette-classic"
          },
          "custom": {
            "axisBorderShow": false,
            "axisCenteredZero": false,
            "axisColorMode": "text",
            "axisLabel": "",
            "axisPlacement": "auto",
            "barAlignment": 0,
            "barWidthFactor": 0.6,
            "drawStyle": "line",
            "fillOpacity": 10,
            "gradientMode": "none",
            "hideFrom": {
              "legend": false,
              "tooltip": false,
              "viz": false
            },
            "insertNulls": false,
            "lineInterpolation": "linear",
            "lineWidth": 1,
            "pointSize": 5,
            "scaleDistribution": {
              "type": "linear"
            },
            "showPoints": "never",
            "spanNulls": false,
            "stacking": {
              "group": "A",
              "mode": "none"
            },
            "thresholdsStyle": {
              "mode": "off"
            }
          },
          "links": [],
          "mappings": [],
          "min": 0,
          "thresholds": {
            "mode": "absolute",
            "steps": [
              {
                "color": "green"
              },
              {
                "color": "red",
                "value": 80
              }
            ]
          },
          "unit": "ms"
        },
        "overrides": []
      },
      "gridPos": {
        "h": 8,
        "w": 12,
        "x": 12,
        "y": 74
      },
      "id": 23,
      "options": {
        "alertThreshold": true,
        "legend": {
          "calcs": [],
          "displayMode": "list",
          "placement": "right",
          "showLegend": true
        },
        "tooltip": {
          "hideZeros": false,
          "mode": "multi",
          "sort": "none"
        }
      },
      "pluginVersion": "11.5.1",
      "targets": [
        {
          "datasource": {
            "uid": "$datasource"
          },
          "expr": "sum(rate(crate_query_sum_of_durations_millis{namespace=\"$namespace\"}[5m])) by (query)\n/\nsum(rate(crate_query_total_count{namespace=\"$namespace\"}[5m])) by (query)",
          "interval": "",
          "legendFormat": "",
          "refId": "E"
        }
      ],
      "title": "Average Query Duration over the last 1 min",
      "type": "timeseries"
    },
    {
      "datasource": {
        "type": "prometheus",
        "uid": "bed18wmashvy8e"
      },
      "fieldConfig": {
        "defaults": {
          "color": {
            "mode": "palette-classic"
          },
          "custom": {
            "axisBorderShow": false,
            "axisCenteredZero": false,
            "axisColorMode": "text",
            "axisLabel": "",
            "axisPlacement": "auto",
            "barAlignment": 0,
            "barWidthFactor": 0.6,
            "drawStyle": "line",
            "fillOpacity": 0,
            "gradientMode": "none",
            "hideFrom": {
              "legend": false,
              "tooltip": false,
              "viz": false
            },
            "insertNulls": false,
            "lineInterpolation": "linear",
            "lineWidth": 1,
            "pointSize": 5,
            "scaleDistribution": {
              "type": "linear"
            },
            "showPoints": "auto",
            "spanNulls": false,
            "stacking": {
              "group": "A",
              "mode": "none"
            },
            "thresholdsStyle": {
              "mode": "off"
            }
          },
          "mappings": [],
          "thresholds": {
            "mode": "absolute",
            "steps": [
              {
                "color": "green"
              },
              {
                "color": "red",
                "value": 80
              }
            ]
          }
        },
        "overrides": []
      },
      "gridPos": {
        "h": 10,
        "w": 24,
        "x": 0,
        "y": 82
      },
      "id": 36,
      "options": {
        "legend": {
          "calcs": [],
          "displayMode": "list",
          "placement": "bottom",
          "showLegend": true
        },
        "tooltip": {
          "hideZeros": false,
          "mode": "single",
          "sort": "none"
        }
      },
      "pluginVersion": "11.5.1",
      "targets": [
        {
          "datasource": {
            "type": "prometheus",
            "uid": "bed18wmashvy8e"
          },
          "editorMode": "code",
          "expr": "sum(crate_connections{property=\"open\", namespace=\"$namespace\"}) by (protocol)",
          "instant": false,
          "legendFormat": "__auto",
          "range": true,
          "refId": "A"
        }
      ],
      "title": "Open Connections",
      "type": "timeseries"
    },
    {
      "collapsed": false,
      "gridPos": {
        "h": 1,
        "w": 24,
        "x": 0,
        "y": 92
      },
      "id": 28,
      "panels": [],
      "title": "Hardware Metrics",
      "type": "row"
    },
    {
      "collapsed": false,
      "gridPos": {
        "h": 1,
        "w": 24,
        "x": 0,
        "y": 93
      },
      "id": 29,
      "panels": [],
      "title": "Network",
      "type": "row"
    },
    {
      "datasource": {
        "uid": "${datasource}"
      },
      "fieldConfig": {
        "defaults": {
          "color": {
            "mode": "palette-classic"
          },
          "custom": {
            "axisBorderShow": false,
            "axisCenteredZero": false,
            "axisColorMode": "text",
            "axisLabel": "",
            "axisPlacement": "auto",
            "barAlignment": 0,
            "barWidthFactor": 0.6,
            "drawStyle": "line",
            "fillOpacity": 0,
            "gradientMode": "none",
            "hideFrom": {
              "legend": false,
              "tooltip": false,
              "viz": false
            },
            "insertNulls": false,
            "lineInterpolation": "linear",
            "lineWidth": 1,
            "pointSize": 5,
            "scaleDistribution": {
              "type": "linear"
            },
            "showPoints": "auto",
            "spanNulls": false,
            "stacking": {
              "group": "A",
              "mode": "none"
            },
            "thresholdsStyle": {
              "mode": "off"
            }
          },
          "mappings": [],
          "thresholds": {
            "mode": "absolute",
            "steps": [
              {
                "color": "green"
              },
              {
                "color": "red",
                "value": 80
              }
            ]
          }
        },
        "overrides": []
      },
      "gridPos": {
        "h": 9,
        "w": 12,
        "x": 4,
        "y": 94
      },
      "id": 11,
      "options": {
        "legend": {
          "calcs": [],
          "displayMode": "list",
          "placement": "bottom",
          "showLegend": true
        },
        "tooltip": {
          "hideZeros": false,
          "mode": "single",
          "sort": "none"
        }
      },
      "pluginVersion": "11.5.1",
      "targets": [
        {
          "datasource": {
            "uid": "${datasource}"
          },
          "editorMode": "code",
          "exemplar": true,
          "expr": "rate(container_cpu_usage_seconds_total{container=\"crate\", pod=~\".*$cluster.*\",namespace='$namespace'}[5m])",
          "interval": "",
          "legendFormat": "",
          "queryType": "randomWalk",
          "range": true,
          "refId": "A"
        },
        {
          "datasource": {
            "type": "prometheus",
            "uid": "${datasource}"
          },
          "editorMode": "code",
          "expr": "sum(rate(container_cpu_usage_seconds_total{container=\"crate\", pod=~\".*$cluster.*\", namespace=\"$namespace\"}[5m]))",
          "hide": false,
          "instant": false,
          "legendFormat": "__auto",
          "range": true,
          "refId": "Sum"
        }
      ],
      "title": "CPU Usage (Cores)",
      "type": "timeseries"
    }
  ],
  "preload": false,
  "refresh": "5s",
  "schemaVersion": 40,
  "tags": [],
  "templating": {
    "list": [
      {
        "current": {
          "text": "prometheus",
          "value": "bed18wmashvy8e"
        },
        "includeAll": false,
        "label": "Datasource",
        "name": "datasource",
        "options": [],
        "query": "prometheus",
        "refresh": 1,
        "regex": "",
        "type": "datasource"
      },
      {
        "current": {
          "text": "",
          "value": ""
        },
        "datasource": {
          "uid": "${datasource}"
        },
        "definition": "cloud_clusters_health",
        "includeAll": false,
        "label": "Cluster",
        "name": "cluster",
        "options": [],
        "query": {
          "query": "cloud_clusters_health",
          "refId": "StandardVariableQuery"
        },
        "refresh": 2,
        "regex": ".*cluster_id=\"(.*?)\".*",
        "type": "query"
      },
      {
        "current": {
          "text": "8ef243b7-bdfb-406f-9a28-3828e67988e4",
          "value": "8ef243b7-bdfb-406f-9a28-3828e67988e4"
        },
        "datasource": {
          "type": "prometheus",
          "uid": "${datasource}"
        },
        "definition": "crate_ready",
        "includeAll": false,
        "name": "namespace",
        "options": [],
        "query": {
          "query": "crate_ready",
          "refId": "StandardVariableQuery"
        },
        "refresh": 1,
        "regex": ".*namespace=\"([0-9a-f\\-]+)\".*",
        "type": "query"
      },
      {
        "current": {
          "text": [
            "All"
          ],
          "value": [
            "$__all"
          ]
        },
        "definition": "label_values(container_cpu_usage_seconds_total{container=\"crate\"}, pod)",
        "description": "",
        "includeAll": true,
        "label": "CrateDB Pod",
        "multi": true,
        "name": "pod",
        "options": [],
        "query": {
          "qryType": 5,
          "query": "label_values(container_cpu_usage_seconds_total{container=\"crate\"}, pod)",
          "refId": "PrometheusVariableQueryEditor-VariableQuery"
        },
        "refresh": 1,
        "regex": "",
        "sort": 1,
        "type": "query"
      }
    ]
  },
  "time": {
    "from": "now-5m",
    "to": "now"
  },
  "timepicker": {},
  "timezone": "",
  "title": "CrateDB Cluster Monitoring Copy",
  "uid": "bed1nxvquemm8f",
  "version": 31,
  "weekStart": ""
}js

Running Ingest Benchmarks

Once the prerequisites are met, you can start benchmarking. You can define your own set of tests to match your specific needs.

All the tests below are executed using:

  • 1 Million rows

This will result in a data volume of:

  • 166 MiB

This is the number of data for the primary shards. When using replicas, this will, of course, affect the data volume. Total size = ‘data volume’ x #replicas

The AVG row size of this table is:

166 MiB = 166 × 1024 × 1024 bytes = 174,063,616 bytes

Note: These tests below were executed with a replica of 1.

Find the optimal batch size

We need to run several tests to determine the optimal batch size. You can do this manually or use a script like this one, which loops through different batch sizes and reports the results in an output file.

find-optimal-batchsize.sh
#!/bin/bash
set -x
# Load environment variables from .env file
if [ -f .env ]; then
    export $(grep -v '^#' .env | xargs)
else
    echo ".env file not found! Exiting..."
    exit 1
fi
# Remove previous output file
rm -f output.txt
# Define fixed parameters inside the script
BATCH_SIZE=1
MAX_ROWS=1000000
SHARDS=12
CONCURRENT_REQUESTS=1
PROCESSES=1
REPLICAS=1
# Define batch sizes
BATCH_SIZES=(500 1000 2000 4000 8000 16000 32000)
# BATCH_SIZES=(500 1000)
# Loop through each batch size
for batch_size in "${BATCH_SIZES[@]}"; do
    # Capture and log the start time
    START_TIME=$(date '+%Y-%m-%d %H:%M:%S')
    echo "Starting benchmark with batch size: $batch_size at $START_TIME" >> output.txt
    # Execute the nodeIngestBench command using node
    node appCluster.js \
        --batch_size "$batch_size" \
        --max_rows "$MAX_ROWS" \
        --shards "$SHARDS" \
        --replicas "$REPLICAS" \
        --concurrent_requests "$CONCURRENT_REQUESTS" \
        --processes "$PROCESSES" >> output.txt
sleep 30
done
echo "All benchmarks executed successfully."
# Display results
mv output.txt output-find-optimal-batch

You should monitor Grafana during the execution to see its impact. On my cluster (3 x CR2), we see this impact.

Grafana dashboard showing three time-series graphs from 12:55 to 13:09. The top graph, 'CPU per POD,' displays three PODs with CPU usage rising from near zero to peaks of about 22–25 units, then declining. The middle graph, 'Memory Usage,' shows memory consumption in MB for the same PODs, peaking at around 130 MB for one POD and around 40–50 MB for the others, before decreasing. The bottom graph, 'Threadpool Rejected Writes,' shows near-zero values throughout the time range.

Putting the numbers of this into a table, we end up with this:

Batch Size
Time (s)
Rows
Speed (rows/sec)
Speed Increase (%)

500

184.433

1,000,000

5,422.023

0

1000

101.466

1,000,000

9,855.518

81.77%

2000

59.838

1,000,000

16,711.789

69.57%

4000

39.030

1,000,000

25,621.317

53.31%

8000

27.812

1,000,000

35,955.703

40.34%

16000

22.712

1,008,000

44,381.825

23.42%

32000

20.024

1,024,000

51,138.634

15.22%

You can see that the curve, looking at the speed increase, is flattening.

Line chart titled 'Batch Size vs Ingestion Speed' showing ingestion speed in rows per second increasing with larger batch sizes. The x-axis ranges from 500 to 32,000 batch size, and the y-axis ranges from 5,000 to just over 50,000 rows/sec. The orange line with dots shows a steady upward curve, indicating higher batch sizes result in faster ingestion speeds

Find the optimal number of shards.

To find the optimal number of shards for this cluster, we must run tests with different sizes to find the sweet spot.

You can run that manually or use a script like this one that loops through different numbers of shards and reports the results in an output file.

find-optimal-shards.sh
#!/bin/bash
set -x
# Load environment variables from .env file
if [ -f .env ]; then
    export $(grep -v '^#' .env | xargs)
else
    echo ".env file not found! Exiting..."
    exit 1
fi
# Remove previous output file
rm -f output.txt
# Define fixed parameters inside the script
BATCH_SIZE=16000
MAX_ROWS=1000000
SHARDS=3
CONCURRENT_REQUESTS=1
PROCESSES=1
REPLICAS=1
# Define number of shards
SHARDS=(3 9 12 18 36 54)
# Loop through each batch size
for shards in "${SHARDS[@]}"; do
    # Capture and log the start time
    START_TIME=$(date '+%Y-%m-%d %H:%M:%S')
    echo "Starting benchmark with number of shards: $shards at $START_TIME" >> output.txt
    # Execute the nodeIngestBench command using node
    node appCluster.js \
        --batch_size "$BATCH_SIZE" \
        --max_rows "$MAX_ROWS" \
        --shards "$shards" \
        --replicas "$REPLICAS" \
        --concurrent_requests "$CONCURRENT_REQUESTS" \
        --processes "$PROCESSES" >> output.txt
sleep 30
done
echo "All benchmarks executed successfully."
# Display results
mv output.txt output-find-optimal-shards.txt
cat output-find-optimal-shards.txt

You should monitor Grafana during the execution to see its impact. On my cluster (3 x CR2), we see this impact.

Grafana dashboard with three time-series panels from 08:39:30 to 08:46:00. Top panel, 'CPU per POD,' shows three PODs with CPU usage rising from near zero to peaks of 25–28 units, then declining. Middle panel, 'Memory Usage,' shows one POD peaking near 65 MB while others remain between 15–45 MB, with fluctuations. Bottom panel, 'Threadpool Rejected Writes,' remains at zero throughout.

This is the outcome of the find-optimal-shards.sh execution.

Shards
Global speed (rows/sec)
Speed Difference (%)

3

32,702.852

0

9

43,812.753

33.97%

12

45,901.639

4.77%

18

44,663.033

-2.70%

36

44,334.975

-0.73%

54

40,173.767

-9.39%

The sweet spot for the number of shards in this cluster and dataset is 12, which is one shard per vCPU in the cluster.

Find the optimal number of clients (processes)

Besides shards and batch sizes, knowing the optimal number of clients can also be beneficial. Execute nodeIngestBench, with different amounts of processes, to find the optimal number for your cluster.

You can run that manually or use a script like this one that loops through different numbers of shards and reports the results in an output file.

find-optimal-clients.sh
#!/bin/bash
set -x
# Load environment variables from .env file
if [ -f .env ]; then
    export $(grep -v '^#' .env | xargs)
else
    echo ".env file not found! Exiting..."
    exit 1
fi
# Remove previous output file
rm -f output.txt
# Define fixed parameters inside the script
BATCH_SIZE=16000
MAX_ROWS=1000000
SHARDS=3
CONCURRENT_REQUESTS=1
PROCESSES=1
REPLICAS=1
# Define number of shards
SHARDS=(3 9 12 18 36 54)
# Loop through each batch size
for shards in "${SHARDS[@]}"; do
    # Capture and log the start time
    START_TIME=$(date '+%Y-%m-%d %H:%M:%S')
    echo "Starting benchmark with number of shards: $shards at $START_TIME" >> output.txt
    # Execute the nodeIngestBench command using node
    node appCluster.js \
        --batch_size "$BATCH_SIZE" \
        --max_rows "$MAX_ROWS" \
        --shards "$shards" \
        --replicas "$REPLICAS" \
        --concurrent_requests "$CONCURRENT_REQUESTS" \
        --processes "$PROCESSES" >> output.txt
sleep 30
done
echo "All benchmarks executed successfully."
# Display results
mv output.txt output-find-optimal-shards.txt
cat output-find-optimal-shards.txt

You should monitor Grafana during the execution to see its impact. On my cluster (3 x CR2), we see this impact.

You can see that the increasing number of processes affects both the CPU usage (the reason you know the CPU going above 100% has to do with the fact that the CrateDB Cloud cluster runs in Kubernetes and allows for CPU bursting for pods using CPU limits. If a pod gets extra CPU time beyond requests, the value can exceed 100%. But you also see that the number of rejected writes in the thread pool is increasing. Looking at the output of the benchmark run, the first number of rejected writes in the thread pool starts when using 48 processes. This is something you want to prevent!

Looking at the run's output, you can see the improvement you get when using three processes instead of one, but also that after two processes per node, you will see a diminishment in performance.

Processes
Global speed (rows/sec)
Speed Difference (%)

1

44,015.545

-

3

108,441.512

146.37%

6

138,839.788

28.03%

12

106,305.752

-23.43%

24

93,549.522

-12.00%

48

65,006.745

-30.49%

Find the cluster saturation point.

When benchmarking a distributed database like CrateDB, cluster saturation is one of the key performance thresholds you'll encounter. It occurs when your cluster reaches its maximum capacity—whether due to CPU constraints, memory pressure, disk I/O bottlenecks, or network congestion—leading to diminishing performance returns as additional queries or workloads are introduced.

Saturation is a critical point in performance testing because it defines the system's operational limits. Identifying it early helps with capacity planning, tuning configurations, and determining when to scale horizontally.

To find the saturation point, we will ramp the number of rows whilst keeping the optimal sizes found during the previous exercises.

find-saturation-point.sh
#!/bin/bash
set -x
# Load environment variables from .env file
if [ -f .env ]; then
    export $(grep -v '^#' .env | xargs)
else
    echo ".env file not found! Exiting..."
    exit 1
fi
# Remove previous output file
rm -f output.txt
# Define fixed parameters inside the script
BATCH_SIZE=16000
MAX_ROWS=1
SHARDS=12
CONCURRENT_REQUESTS=1
PROCESSES=6
REPLICAS=1
# Define number of processes
ROWS=(1000000 2000000 4000000 8000000 16000000 32000000)
# Loop through each batch size
for rows in "${ROWS[@]}"; do
    # Capture and log the start time
    START_TIME=$(date '+%Y-%m-%d %H:%M:%S')
    echo "Starting benchmark with number of max_rows: $rows at $START_TIME" >> output.txt
    # Execute the nodeIngestBench command using node
    node appCluster.js \
        --batch_size "$BATCH_SIZE" \
        --max_rows "$rows" \
        --shards "$SHARDS" \
        --replicas "$REPLICAS" \
        --concurrent_requests "$CONCURRENT_REQUESTS" \
        --processes "$PROCESSES" >> output.txt
sleep 30
done
echo "All benchmarks executed successfully."
# Display results
mv output.txt output-find-saturation-point.txt
cat output-find-saturation-point.txt

Looking at the Grafana dashboard, you don't see a problem directly, but the decrease in speed for the run with 32 million rows indicates that something is slowing the ingest down.

Max Rows
Global speed (rows/sec)
Speed Difference (%)

1,000,000

108,352.144

-

2,000,000

105,529.759

-2.60%

4,000,000

97,637.180

-7.48%

8,000,000

97,551.458

-0.09%

16,000,000

95,754.294

-1.84%

32,000,000

75,474.309

-21.15%

Looking at the File System Writes, you can see that after 30 minutes, the performance goes down to around 25MB/s. We used small disks (32GiB) for this performance test with a standard throughput of 25 MB/sec with 30 minutes of bursting. In this case, the bottleneck Is the disk throughput. With large disks, we will get more IOPS and more throughput.

Query Benchmarking

We use Locust to run load tests using a customizable set of SQL statements. It is a great, flexible, open-source (Python) framework that can swarm the database with users and obtain the RPS (request per second) for different queries.

Setup Locust

Installing Locust is easy. Please execute the following to install it on the same box tool/benchmark VM you use to execute nodeIngestBench.

pip3 install -U locust crate

To run Locust and execute queries, you will need to create a file named locustfile.py

You can use this as a starting point. It will be configured to run queries against the same table created by running nodeIngestBench.

locustfile.py
import time
import random
from locust import task, User, between, constant_throughput
from crate import client
# If a host is provided through the Locust UI, that host will be used.
# Otherwise, there is a fallback to the host provided here.
CRATEDB_HOST = "http://blush-nien-nunb.aks1.westeurope.azure.cratedb.net:4200"
# Credentials are always used from here to not have them leak into the UI as
# part of the connection URL.
CRATEDB_USERNAME = "locust"
CRATEDB_PASSWORD = "load_test"
# CrateDBClient wraps the CrateDB client and returns results in a
# Locust-compatible data structure with additional metadata
class CrateDBClient:
    def __init__(self, host, request_event):
        self._connection = client.connect(
            servers=host or CRATEDB_HOST,
            username=CRATEDB_USERNAME,
            password=CRATEDB_PASSWORD,
        )
        self._request_event = request_event
    def send_query(self, *args, **kwargs):
        cursor = self._connection.cursor()
        start_time = time.perf_counter()
        request_meta = {
            "request_type": "CrateDB",
            "name": args[1],  # Static request name
            "response_length": 0,
            "response": None,
            "context": {},
            "exception": None,
        }
        response = None
        try:
            cursor.execute(args[0])
            response = cursor.fetchall()
        except Exception as e:
            request_meta["exception"] = e
        request_meta["response_time"] = (time.perf_counter() - start_time) * 1000
        request_meta["response"] = response
        request_meta["response_length"] = len(str(response))
        # Log the request in Locust
        self._request_event.fire(**request_meta)
        return response
class CrateDBUser(User):
    abstract = True
    def __init__(self, environment):
        super().__init__(environment)
        self.client = CrateDBClient(self.host, request_event=environment.events.request)
class QuickstartUser(CrateDBUser):
    wait_time = constant_throughput(1.0)
    # Precise Datacenter List
    datacenters = [
        "us-west-2a", "sa-east-1b", "eu-central-1b", "us-east-1b", "us-west-2c",
        "eu-west-1b", "us-west-1b", "ap-southeast-2a", "ap-southeast-1b", "eu-central-1a",
        "sa-east-1c", "sa-east-1a", "ap-southeast-2b", "ap-southeast-1a", "eu-west-1c",
        "eu-west-1a", "ap-northeast-1a", "us-west-1a", "us-west-2b", "ap-northeast-1c",
        "us-east-1a", "us-east-1c", "us-east-1e"
    ]
    # Service Environments
    service_environments = ["test", "production", "staging"]
    # Hosts for specific queries (host_1000 to host_3000)
    hosts = [f"host_{i}" for i in range(1000, 3001)]
    # -------------------------------
    # Point Queries (Fast Execution)
    # -------------------------------
    @task(10)
    def point_query_latest_cpu_metrics(self):
        random_host = random.choice(self.hosts)
        self.client.send_query(
            f"""
            SELECT
              usage_user,
              usage_system,
              usage_idle,
              usage_nice,
              usage_iowait,
              usage_irq,
              usage_softirq,
              usage_steal,
              usage_guest,
              usage_guest_nice
            FROM doc.cpu
            WHERE tags['hostname'] = '{random_host}'
              AND ts = (
                  SELECT max(ts) FROM doc.cpu WHERE tags['hostname'] = '{random_host}'
              );
            """,
            "Point Query - Latest CPU Metrics"
        )
    @task(8)
    def point_query_recent_cpu_snapshot(self):
        random_host = random.choice(self.hosts)
        self.client.send_query(
            f"""
            SELECT usage_user, usage_system, usage_idle
            FROM doc.cpu
            WHERE tags['hostname'] = '{random_host}'
              AND ts >= CURRENT_TIMESTAMP - INTERVAL '5 minutes'
            ORDER BY ts DESC
            LIMIT 1;
            """,
            "Point Query - Recent CPU Snapshot"
        )
    @task(9)
    def point_query_specific_service(self):
        service_env = random.choice(self.service_environments)
        self.client.send_query(
            f"""
            SELECT tags['hostname'], usage_user, usage_system
            FROM doc.cpu
            WHERE tags['service_environment'] = '{service_env}'
            ORDER BY ts DESC
            LIMIT 1;
            """,
            "Point Query - Specific Service"
        )
    @task(7)
    def point_query_high_cpu_hosts(self):
        self.client.send_query(
            """
            SELECT tags['hostname'], usage_user
            FROM doc.cpu
            WHERE usage_user > 80
            ORDER BY ts DESC
            LIMIT 5;
            """,
            "Point Query - High CPU Hosts"
        )
    # -------------------------------
    # Reduced Heavy Queries
    # -------------------------------
    @task(2)
    def query01_max_user_per_datacenter(self):
        datacenter_filter = random.choice(self.datacenters)
        self.client.send_query(
            f"""
            SELECT tags['datacenter'],
                   MAX_BY(tags['hostname'], usage_user) AS max_user_host,
                   MAX(usage_user) AS max_usage_user
            FROM doc.cpu
            WHERE tags['datacenter'] = '{datacenter_filter}'
            GROUP BY tags['datacenter'];
            """,
            "Max User CPU per Datacenter"
        )
    @task(1)
    def query02_moving_avg_user_cpu(self):
        datacenter_filter = random.choice(self.datacenters)
        self.client.send_query(
            f"""
            WITH aggregated AS (
              SELECT tags['hostname'] AS hostname,
                     DATE_TRUNC('minute', ts) AS minute_ts,
                     AVG(usage_user) AS avg_user_per_minute
              FROM doc.cpu
              WHERE tags['datacenter'] = '{datacenter_filter}'
              GROUP BY tags['hostname'], minute_ts
            )
            SELECT hostname,
                   minute_ts,
                   avg_user_per_minute,
                   AVG(avg_user_per_minute) OVER (PARTITION BY hostname ORDER BY minute_ts ROWS BETWEEN 2 PRECEDING AND CURRENT ROW) AS moving_avg_user
            FROM aggregated;
            """,
            "Moving Avg User CPU (Datacenter Filter)"
        )

In addition to the pure Locust execution, it contains a CrateDB-specific implementation. Instead of a plain HTTP client, it connects to CrateDB using our Python driver.

Configured Queries

In this example locustfile, there are in total 6 different queries. See the underlying table.

Query Name
General Explanation
Type Query
Weight
Avg result size (bytes)

Max User CPU per Datacenter

Gets max user CPU per data center.

Aggregation

2

34.31

Point Query - Latest CPU Metrics

Fetches the latest CPU metrics for a specific host.

Point Query

10

2707.98

Point Query - Specific Service

Gets the latest CPU data for a random service environment.

Point Query

9

1500.00

Point Query - Recent CPU Snapshot

Gets the most recent CPU snapshot for a host.

Point Query

8

4.89

Point Query - High CPU Hosts

Finds hosts with usage_user greater than 80.

Point Query

7

2000.00

Moving Avg User CPU (Datacenter Filter)

Computes the moving average of user CPU in the data center.

Window Function

1

76488.4

The Weight value in Locust determines how frequently a specific task (query) runs relative to other tasks. It balances the load between lightweight and heavyweight queries.

  • Higher Weight → More Frequent Execution

A task with a higher weight will be executed more often, increasing its share of the total requests.

  • Lower Weight → Less Frequent Execution

A lower weight means the task will be called less frequently, usually for heavier or more resource-intensive queries.

For example, If you have:

  • Point Query - Latest CPU Metrics with weight 10, and

  • Moving Avg User CPU (Datacenter Filter) with weight 2,

Locust will run the point query 5 times more often than the window function query.

Query Benchmark - Using Locust

You can start running Locust using the example queries from the blog. Start by doing a small number of users and gradually ramp up to see the effect on resource consumption. This example locustfile is built so that the operations/sec will be ~ equal to the number of users. So, if you estimate 50 queries per second, you can ramp up to 50 users and see how it affects both response times and resource consumption.

You should run Locust first to see if everything is working and, therefore, configured correctly. After this, the goal is to run both the ingests using nodeIngestBench and Locust to understand their impact.

Start Locust

Once the locust.py is configured, you can start running Locust. Suppose you want to run a locust with multiple processes. In that case, you can start Locust by specifying --processes or using -1 to autodetect the number of logical cores in your machine and launch one worker per vCPU.

In my case, I'm starting Locust with 8 processes, so I have some additional processes that can run the ingest simultaneously.

locust --processes 8
[2025-02-20 11:57:43,246] ce-bench-vm/INFO/locust.main: Starting Locust 2.32.9
[2025-02-20 11:57:43,278] ce-bench-vm/INFO/locust.main: Starting web interface at http://0.0.0.0:8089
[2025-02-20 11:57:43,301] ce-bench-vm/INFO/locust.runners: ce-bench-vm_7ad3d8b00435418191ef885ee7f2257d (index 0) reported as ready. 1 workers connected.
[2025-02-20 11:57:43,301] ce-bench-vm/INFO/locust.runners: ce-bench-vm_071629ca235f47e7af19719a71cda867 (index 1) reported as ready. 2 workers connected.
[2025-02-20 11:57:43,301] ce-bench-vm/INFO/locust.runners: ce-bench-vm_d0d0af1b77a34833a860f5f8bc016d9d (index 2) reported as ready. 3 workers connected.
[2025-02-20 11:57:43,301] ce-bench-vm/INFO/locust.runners: ce-bench-vm_f4da22679dad4487aca72a6cf958ed11 (index 3) reported as ready. 4 workers connected.
[2025-02-20 11:57:43,302] ce-bench-vm/INFO/locust.runners: ce-bench-vm_0958b78240c84fe49dafc5181339cc5c (index 4) reported as ready. 5 workers connected.
[2025-02-20 11:57:43,302] ce-bench-vm/INFO/locust.runners: ce-bench-vm_33af84bf3e594d56916f5dbffa927f03 (index 5) reported as ready. 6 workers connected.
[2025-02-20 11:57:43,302] ce-bench-vm/INFO/locust.runners: ce-bench-vm_8bc157f743ec4b519fdbe91f4b404abe (index 6) reported as ready. 7 workers connected.
[2025-02-20 11:57:43,302] ce-bench-vm/INFO/locust.runners: ce-bench-vm_369a4bec7e284dc68fdfbf819feb0967 (index 7) reported as ready. 8 workers connected.

Connect to the locust web interface at port 8089. When starting a new load test, specify the number of users (peak concurrency), the rampup, and the host. The host will be the end-point, so it is your CrateDB cluster in this case. Under Advanced options, you can specify the runtime. In this case, I leave it blank because I want to be in charge of stopping or ramping up.

Click start to kick off the first run. After the configure clients are started we should see something like this.

In the aggregated row, you should see ~50 RPS, the same as the number of configured users. That, in combination with zero failures, means that Locust Is running as it should, and you are ready to start benchmarking.

Let's see what the effect is on the load on the cluster using Grafana.

Queries + Ingest

Let's add the ingest to the mix. As nodeIngestBench is designed to push maximally, running a while loop like this one is advised. With max_rows < 16000, please use the same batch_size as the max_row. That way, you can control the rows per second. In this case, it will run 1000 ingests per second, which can easily be changed to more rows per second.

while true; do
	node appCluster.js --drop_table false --batch_size 1000 --max_rows 1000 --processes 1 --concurrent_requests 1
	sleep 1
done

In Locust, we see that the throughput is still at 50 queries/sec.

Both the 50th and 95th percentiles fluctuate a bit more than before. In Grafana, we see an increase in CPU usage, which is to be expected, but the load is still good.

In Grafana, we see an increase in CPU usage

Ramp up - 100 Queries/sec.

While keeping 1000 rows/sec, let's double the number of queries by increasing the number of users in Locust to 100.

100 users

Look at the performance graphs in Grafana to see the load on the cluster.

Load with 100 users and 1000 ingest/sec

Ramp up - 150 Queries/sec

While keeping the ingest at 1000 rows per second, we will gradually increase the number of queries per second to see the effect. In this case, we will add one user per second.

After some time, we saw that all the users had been spawned, and 150 queries/second had been executed.

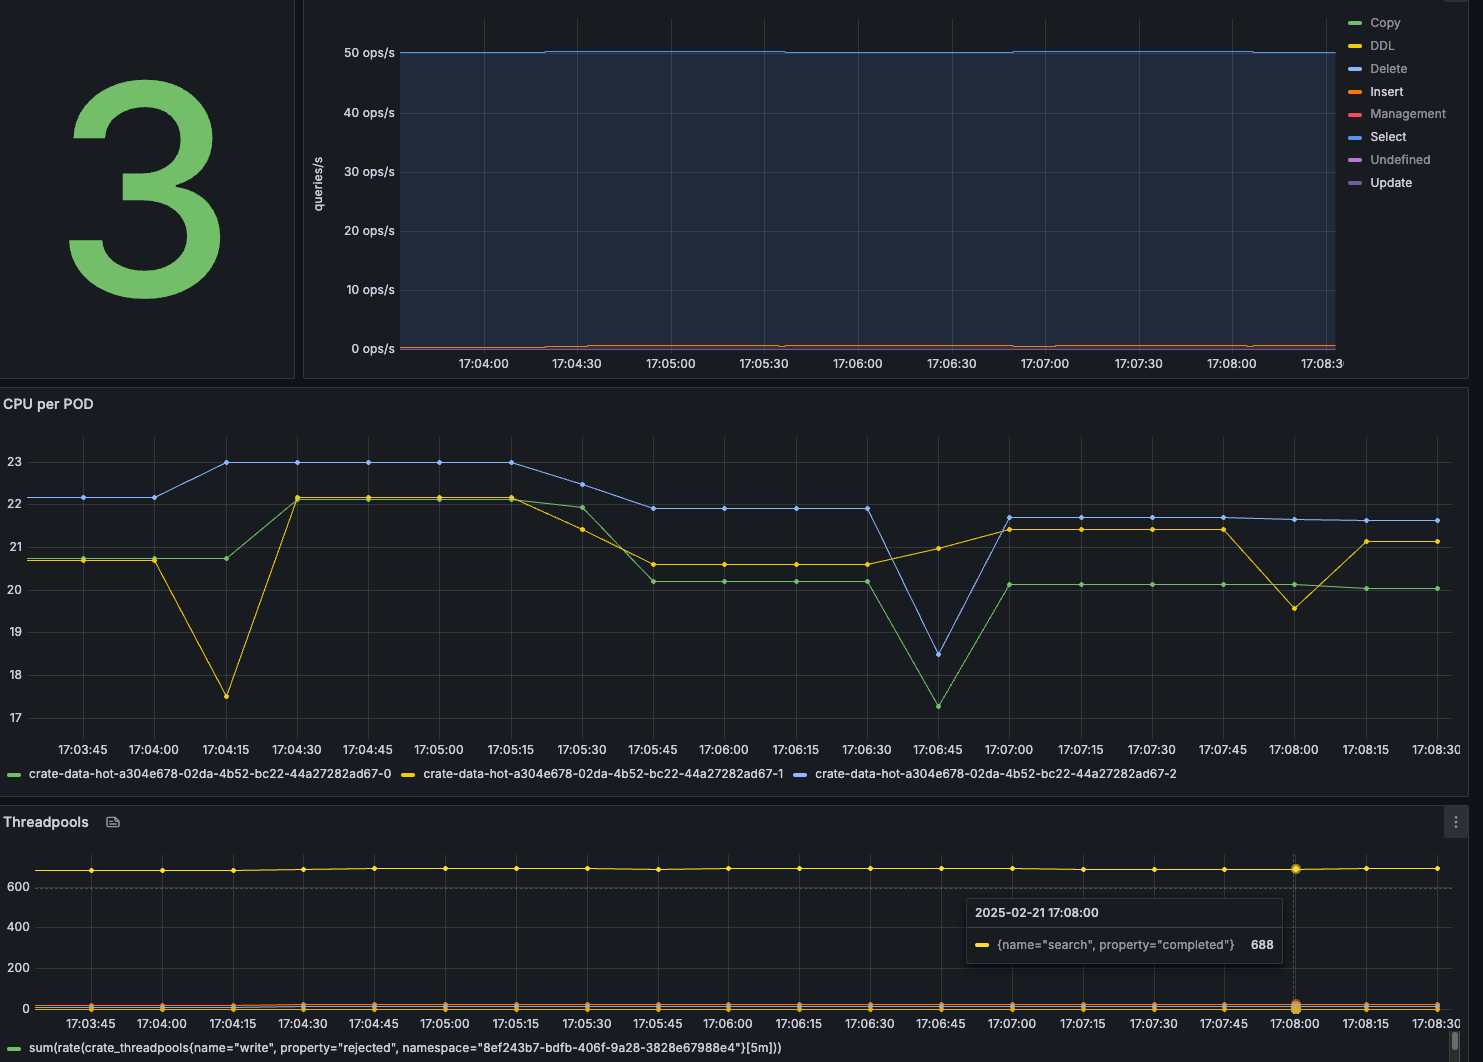
In the chars view in Locust, the RPS is ~ 150, with 0 failures.

In Grafana, we see CPU between 55% and 65%. There is no rejection in the thread pool, so everything is still good!

150 Queries/sec and 1000 ingest/sec

Ramp up - 200 Queries/sec

150 Queries/sec and 1000 ingest/sec
200 Queries/Sec plus 1000 Ingest/sec

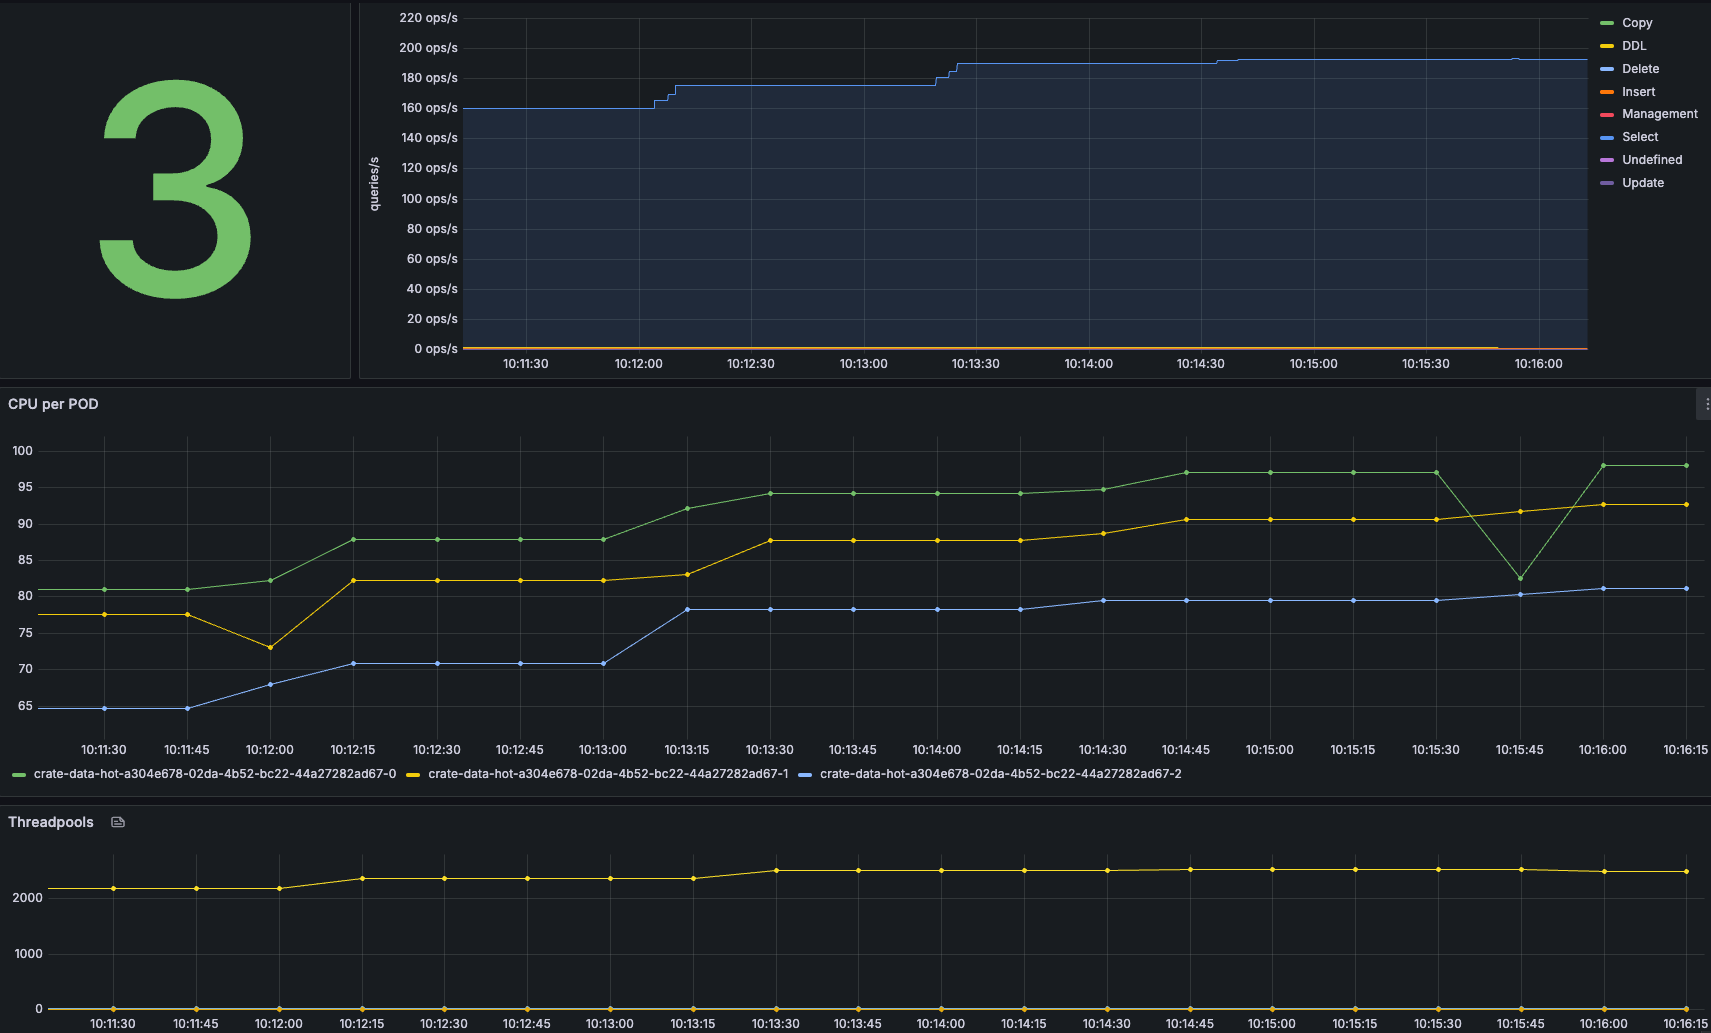
Looking at the cluster and the load, it becomes clear that even with 200 OPS/sec, the cluster is busy but stable! As soon as the graphs in Locust become flaky, you know you are reaching the limits of your cluster.

The Locust charts show that the RPS line is no longer flat but that the number of queries/sec starts to fluctuate more, indicating that the cluster is under more pressure than before.


Conclusion

When deploying CrateDB (or any distributed database), assumptions about performance and scalability are never enough—they must be validated through rigorous benchmarking. Estimating cluster size, optimizing shard configurations, and fine-tuning parameters are crucial first steps, but only real-world testing can reveal actual system behavior under load.

By systematically running ingest and query benchmarks, we:

✅ Identify performance bottlenecks (e.g., CPU saturation, disk I/O limits, or inefficient sharding). ✅ Find the "sweet spot" for batch sizes, shard counts, and concurrency settings. ✅ Determine system limits and when to scale before hitting production issues. ✅ Ensure cost efficiency by using only the necessary resources for the expected workload.

Performance tuning is an iterative process. Benchmark, monitor, adjust, and repeat—this is the only way to ensure your CrateDB deployment runs efficiently, reliably, and cost-effectively at scale. Don't guess—test!

Last updated